In this note we will look at how to plot data from a dataset. We will be using the dataset presented in this paper on “the absorption characteristics of extracted phytoplankton pigments”.
We use a DataFrame, a collection type that is similar to a table/excel-sheet, to store the data. If you are interested in learning more about these you can look at the extra material for TØ5. This weeks extra material dives into how to do calculations with a DataFrame.
The table below shows an excerpt of the dataset. The first column wavelength_nm is the wavelength in nanometers while the other columns are adsorptions measurements for different substances.
import pandas as pdpigments = pd.read_csv('../../datasets/curated_abs_dataset.csv')display(pigments)
wavelength_nm
chlorophyll-a
chlorophyll-b
fucoxanthin
prasinoxanthin
0
800.2
0.0
0.000035
0.000629
0.000128
1
799.3
0.0
0.000000
0.000588
0.000166
2
798.5
0.0
0.000000
0.000599
0.000165
3
797.6
0.0
0.000000
0.000548
0.000216
4
796.7
0.0
0.000086
0.000491
0.000086
...
...
...
...
...
...
558
324.0
NaN
NaN
0.003124
0.002171
559
323.1
NaN
NaN
0.003056
0.002062
560
322.3
NaN
NaN
0.003098
0.002207
561
321.4
NaN
NaN
0.003092
0.002202
562
320.6
NaN
NaN
0.003042
0.002189
563 rows × 5 columns
1 Plotting
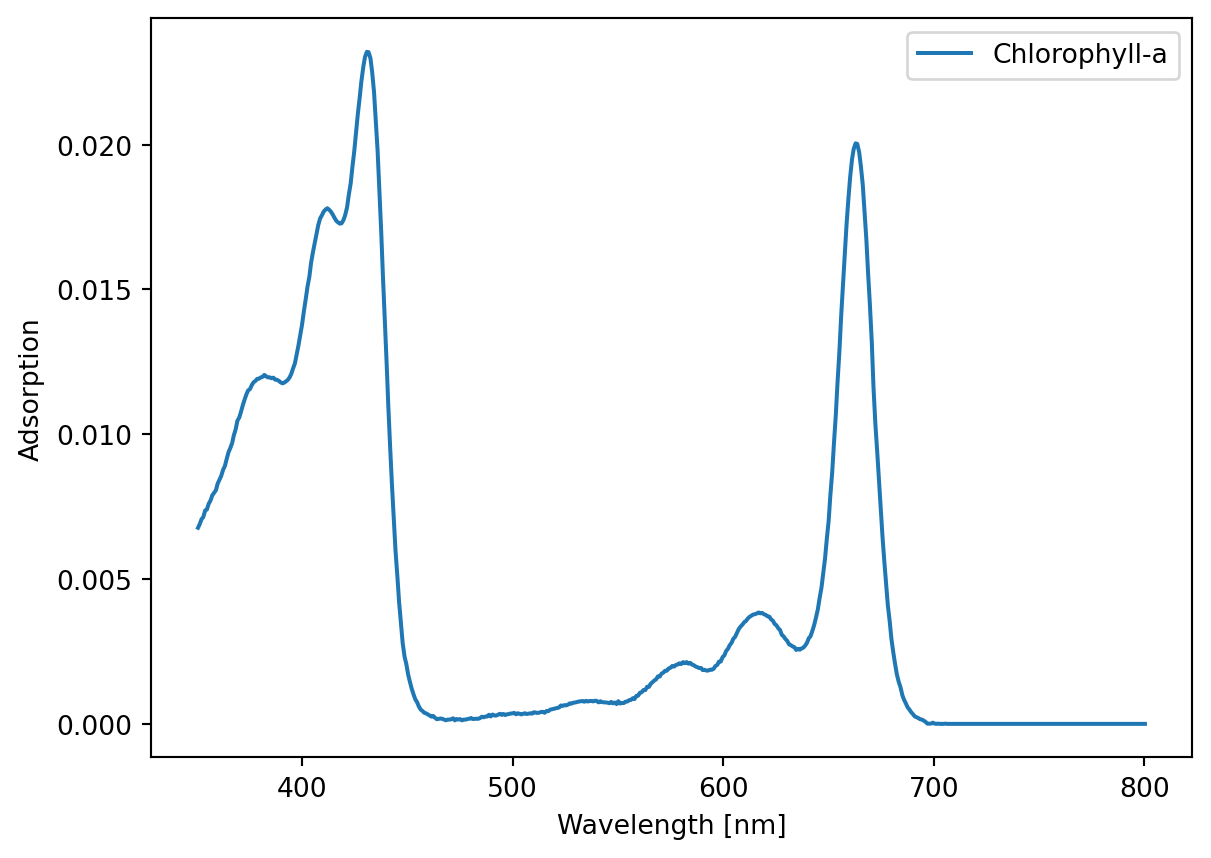
One of the best ways to explore a dataset is to plot it, below one column of the dataset is plotted
import matplotlib.pyplot as pltfig, ax = plt.subplots()# Plottingax.plot(pigments['wavelength_nm'], pigments['chlorophyll-a'], 1 label='Chlorophyll-a')# These are settings to make the plot look nice2ax.set_xlabel('Wavelength [nm]')ax.set_ylabel('Adsorption')3ax.legend()# This tell Python to display the plot.4plt.show()
1
Here we plot by picking the x-axis as the wavelength from the dataset and the y-axis as measurements of chlorophyll-a
2
Setting the x-axis name.
3
Show the label in a little box, helps if we plot multiple curves in the same figure.
4
Show the plot.
1.1 Exercise: Plotting
Use the cell below to plot some of the other columns of the dataset.
Try to plot several columns at the same time.
1.2 Exercise: Interpreting plots
Chlorophyll a is the main photosynthetic pigment, while chlorophyll b is an accessory pigment found in green algae and land plants. Use the plotted spectra to explain why having both pigments could be useful.